Deep neural networks achieve strong performance in visual recognition but can become unreliable when deployment data differ from their training distributions. Such distribution shifts arise from changes in lighting, image corruption, acquisition devices, environmental conditions, and previously unseen categories. At the same time, applying computationally expensive models to every input can be inefficient in resource-constrained environments.
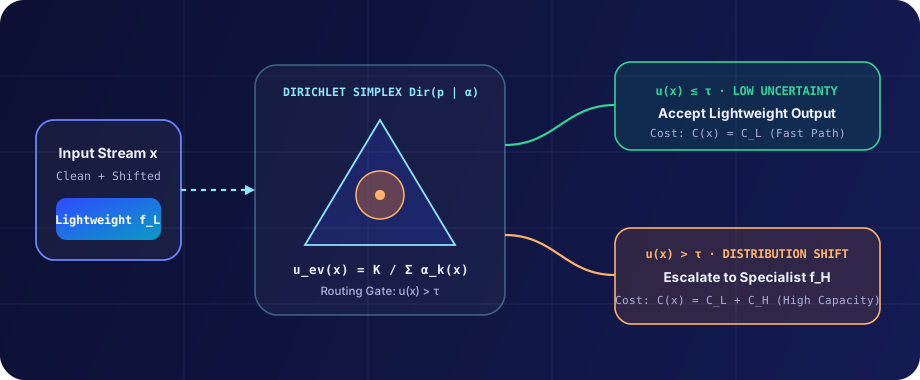
This research proposes an evidential uncertainty-guided adaptive inference framework that dynamically allocates computation according to the estimated uncertainty of individual predictions. The framework will combine a lightweight visual recognition model, an uncertainty estimator, a routing policy, and a higher-capacity specialist model. Inputs receiving sufficiently reliable predictions may be processed using the lightweight model alone, while uncertain inputs may be escalated to the specialist model when the expected improvement justifies the additional computational cost.
The study will investigate three research questions: whether evidential uncertainty can identify unreliable predictions under distribution shift, whether uncertainty-guided routing can improve the accuracy–efficiency trade-off, and whether the resulting system can satisfy explicit reliability and computational constraints. Experiments will use public image classification datasets, controlled corruption benchmarks, and multiple training seeds. Performance will be evaluated using classification accuracy, calibration error, corruption robustness, inference latency, and computational cost.
The expected contribution is an experimentally evaluated adaptive inference methodology with explicit routing constraints and reproducible evaluation procedures. Rather than assuming that uncertainty estimation automatically improves reliability, the research will compare evidential uncertainty against confidence-based and entropy-based alternatives under identical computational budgets.
Introduction
1.1 Background
Artificial intelligence systems are increasingly used in manufacturing, transportation, medical imaging, environmental monitoring, and other applications involving visual data. Modern convolutional neural networks and vision transformers can learn complex representations from large datasets, often achieving high classification accuracy under familiar evaluation conditions.
However, high performance on a test set drawn from the same distribution as the training data does not guarantee reliable performance after deployment. Images captured under unusual lighting, motion blur, sensor noise, weather changes, or unfamiliar acquisition conditions can cause substantial degradation.
A second challenge is computational efficiency. High-capacity models may improve predictive performance, but they also require more memory, processing time, and energy. Running a large model on every input can be unnecessary when many inputs can already be classified reliably by a compact model.
These challenges motivate adaptive inference: a system that allocates different amounts of computation to different inputs according to their characteristics and predicted difficulty.
1.2 Motivation
Consider an automated visual inspection system deployed on a production line. Most images may contain ordinary, easily recognized products. A smaller fraction may contain unusual defects, low-quality images, or unfamiliar product variants.
A fixed lightweight model may be fast but unreliable on difficult inputs. A fixed large model may provide better accuracy but consume unnecessary resources on easy inputs.
An adaptive system could use a compact model first, estimate the reliability of its prediction, and invoke a specialist model only when additional computation is expected to be beneficial.
The challenge is determining when the lightweight prediction is sufficiently reliable, especially when the input distribution changes.
1.3 Research Problem
The central research problem is:
How can a visual recognition system allocate computation adaptively using uncertainty estimates while maintaining reliable predictive performance under distribution shift?
The problem combines three technical areas:
- Computer Science: Model routing, inference pipelines, and computational resource allocation.
- Artificial Intelligence: Deep learning, uncertainty estimation, and visual recognition.
- Applied Mathematics: Probability theory, calibration, constrained optimization, and statistical evaluation.
1.4 Research Aim
The aim is to develop and evaluate an uncertainty-guided adaptive inference framework that balances predictive reliability, computational cost, and robustness to distribution shift.
1.5 Research Objectives
The research will pursue the following objectives:
- 1Develop a lightweight visual recognition model and a higher-capacity specialist model.
- 2Implement and evaluate evidential, entropy-based, and maximum-probability uncertainty estimators.
- 3Design a compute-aware routing policy that escalates uncertain inputs to additional computation.
- 4Evaluate the proposed framework under clean, corrupted, and distribution-shifted conditions.
- 5Quantify the trade-off among accuracy, calibration, inference latency, and computational cost.
- 6Assess whether the framework satisfies predefined reliability and resource constraints across multiple experimental seeds.
Problem Statement and Research Gap
2.1 Problem Statement
Let an input image be represented by \(x\), and let its true class be \(y\). A trained classifier estimates a predictive distribution over \(K\) possible classes:
A conventional system selects the class with the largest predicted probability:
This decision rule does not explicitly account for the cost of an incorrect prediction or the availability of additional computation.
Suppose two models are available:
- \(f_L\): a lightweight model with low computational cost.
- \(f_H\): a higher-capacity specialist model with greater computational cost.
The system must decide whether to accept the lightweight prediction or invoke the specialist model. This decision should consider uncertainty, the expected benefit of escalation, and the computational budget.
A routing policy based only on confidence may be insufficient if confidence scores are poorly calibrated or become unreliable under distribution shift. Conversely, a sophisticated uncertainty estimator may add computational overhead or fail to identify certain types of distribution shift.
Therefore, the research will investigate whether evidential uncertainty can support a more reliable and cost-effective routing mechanism.
2.2 Research Gap
Existing research provides several relevant foundations:
- Confidence calibration improves the interpretation of predicted probabilities.
- Deep ensembles and Bayesian-inspired methods can estimate predictive uncertainty.
- Early-exit networks reduce computation by terminating inference at intermediate stages.
- Mixture-of-experts systems allocate inputs to specialized computational pathways.
- Test-time adaptation methods attempt to improve predictions when deployment data differ from training data.
However, these approaches do not automatically provide a complete solution to the specific problem addressed here. In particular, the study will investigate the interaction among uncertainty quality, routing decisions, distribution shift, and computational constraints.
The proposed research gap is a testable hypothesis, not a claim that no previous work has combined these components. A systematic literature review will determine the precise novelty relative to existing uncertainty-aware routing and adaptive inference methods.
The study will focus on the following questions:
- Does evidential uncertainty provide useful routing information beyond conventional confidence and entropy?
- Does the benefit persist across different types and severities of distribution shift?
- Can routing decisions be made while respecting an explicit computational budget?
- How does the routing policy behave when the uncertainty estimator itself is unreliable?
2.3 Scope of the Research
The primary study will concern closed-set image classification, where the evaluated images belong to a predefined set of classes. Distribution shift will be introduced through controlled image corruptions and selected cross-domain evaluations.
Open-set recognition, autonomous control, online reinforcement learning, and safety-critical deployment will not be primary experimental objectives. These areas may be considered in future work.
Research Questions and Hypotheses
3.1 Research Questions
- RQ1: How accurately can evidential uncertainty identify unreliable predictions under clean and distribution-shifted conditions?
- RQ2: Can uncertainty-guided routing improve the relationship between classification performance and computational cost compared with fixed-model and confidence-based baselines?
- RQ3: How sensitive is the proposed framework to the severity and type of distribution shift?
- RQ4: Can the routing policy satisfy a predefined average computational budget without exceeding an acceptable error rate?
3.2 Research Hypotheses
| ID | Hypothesis | Evaluation Approach |
|---|---|---|
| H1 | Evidential uncertainty will improve the ranking of prediction errors in at least some shifted settings. | Error-detection AUROC and risk–coverage analysis |
| H2 | Adaptive routing will reduce average computational cost relative to always using the specialist model while maintaining a comparable error rate. | Cost–accuracy curves |
| H3 | A routing policy calibrated on validation data will perform differently across corruption types and severities. | Cross-corruption evaluation |
| H4 | Explicit cost and risk constraints will produce more predictable operating points than an unconstrained uncertainty threshold. | Constraint satisfaction across test conditions |
These hypotheses are falsifiable. The proposed method will not be considered successful merely because it achieves higher accuracy on one dataset.
Literature Review
4.1 Predictive Uncertainty and Calibration
Deep neural networks can produce highly confident predictions even when they are incorrect. Guo et al. [1] demonstrated that modern neural networks may be poorly calibrated and studied temperature scaling as a post-processing method.
Calibration concerns the relationship between predicted confidence and observed correctness. A model is ideally calibrated when predictions assigned confidence \(0.8\) are correct approximately 80% of the time over an appropriate population.
Calibration is useful but does not guarantee robustness under distribution shift. A model calibrated on one validation distribution may become miscalibrated when deployment conditions change.
4.2 Bayesian Approximations and Ensembles
Bayesian neural networks represent uncertainty through distributions over model parameters. In practice, exact Bayesian inference is often computationally difficult for deep learning systems.
Lakshminarayanan et al. [2] introduced deep ensembles as a practical approach to predictive uncertainty estimation. Ensembles can provide strong predictive performance and uncertainty estimates, but they require multiple model evaluations and therefore may be expensive in resource-constrained environments.
This research will use ensembles as a reference method where computationally feasible, while also evaluating less expensive uncertainty estimators.
4.3 Evidential Deep Learning
Sensoy et al. [3] proposed an evidential deep learning framework in which a neural network predicts evidence associated with the classes of a Dirichlet distribution.
Instead of producing only a single probability vector, the network produces nonnegative evidence values that determine the parameters of a distribution over categorical probabilities.
This representation provides a way to describe both predicted class probabilities and the concentration of the corresponding probability distribution. Nevertheless, evidential estimates can also become unreliable under unfamiliar inputs or distribution shift. Their usefulness must therefore be established empirically.
4.4 Adaptive Computation and Early Exits
Adaptive computation allocates resources according to the difficulty of an input. Early-exit neural networks, such as the approach studied by Teerapittayanon et al. [4], allow a model to terminate processing when an intermediate prediction meets a chosen criterion.
Early-exit methods can reduce average inference cost. Their effectiveness depends on the reliability of the exit criterion, the distribution of input difficulty, and the computational overhead of intermediate predictions.
The proposed research differs in emphasis by investigating an uncertainty-guided decision between a lightweight model and a specialist model, with particular attention to shifted inputs and explicit resource constraints.
4.5 Distribution Shift and Robustness
Hendrycks and Dietterich [5] introduced ImageNet-C and CIFAR-10-C benchmarks for evaluating common image corruptions. Such benchmarks help measure robustness to changes such as blur, noise, and weather-related degradation.
Distribution shift is broader than synthetic corruption. It can also arise from changes in camera hardware, production environments, class prevalence, and image acquisition procedures.
The study will therefore treat corruption robustness as a controlled experimental setting rather than a complete representation of real-world distribution shift.
4.6 Mixture-of-Experts Systems
Mixture-of-experts models use a routing mechanism to determine which expert processes an input. Modern sparse expert architectures can allocate computation selectively, but their routing mechanisms, training requirements, and systems overhead may be substantial [7].
The proposed framework will investigate a simpler two-pathway arrangement suitable for a master's research project: a lightweight model for routine predictions and a specialist model for inputs requiring further computation.
4.7 Research Positioning
The research will compare its design against uncertainty estimation, early-exit, ensemble, and adaptive routing literature. The main evaluation question is not whether combining these ideas is inherently novel, but whether a carefully specified uncertainty-guided policy provides a measurable advantage under distribution shift and constrained computation.
Proposed Methodology
5.1 Research Design
The project will follow a quantitative experimental research design.
The workflow consists of:
- 1Literature review and specification of research hypotheses.
- 2Dataset preparation and shift construction.
- 3Training or selection of baseline models.
- 4Implementation of uncertainty estimators.
- 5Development of the routing policy.
- 6Evaluation on held-out test data.
- 7Statistical analysis, ablation studies, and reproducibility checks.
Training, validation, and test sets will remain separate. Routing thresholds will be selected using validation data, not the final test set.
5.2 Proposed System Architecture
flowchart TD
    A["Input Image"] --> B["Lightweight Visual Model"]
    B --> C["Predictive Distribution"]
    C --> D["Uncertainty Estimator"]
    D --> E{"Routing Decision"}
    E -->|Sufficient confidence| F["Accept Lightweight Prediction"]
    E -->|Uncertain or High Risk| G["Specialist Model"]
    G --> H["Specialist Prediction"]
    F --> I["Final Prediction and Cost Log"]
    H --> I
Figure 1: Conceptual architecture of the proposed framework. (Design specification indicating proposed workflow).
The framework contains four principal components:
- Component A — Lightweight Model: A compact model produces an initial prediction at relatively low cost.
- Component B — Uncertainty Estimator: The estimator derives a score from the lightweight model's output. Candidate scores include maximum-probability confidence, predictive entropy, and evidential uncertainty.
- Component C — Routing Policy: A decision rule compares the uncertainty score and expected benefit of additional computation against a cost constraint.
- Component D — Specialist Model: The specialist model processes selected inputs and provides the final prediction. Its prediction may replace the initial prediction or be combined with it under a predefined rule.
The initial implementation will use two models rather than a large collection of experts. This reduces implementation complexity and allows the effect of the routing policy to be studied more clearly.
5.3 Dataset Selection
| Dataset | Purpose | Initial Experimental Setup |
|---|---|---|
| CIFAR-10 | Development and controlled experimentation | \(32 \times 32\) images, 10 classes [6] |
| CIFAR-10-C | Common-corruption robustness | Corruption types and severity levels [5] |
| ImageNet-100 (if resources permit) | Larger-scale evaluation | A fixed, documented 100-class subset [11] |
| Selected real-world domain-shift dataset (if feasible) | Additional external validation | Dataset selected after reviewing licensing and domain compatibility |
CIFAR-10 contains 60,000 colour images across 10 classes, conventionally divided into 50,000 training images and 10,000 test images [6]. CIFAR-10-C introduces common corruptions for robustness evaluation [5].
The final dataset selection will depend on available computing resources, licensing, and compatibility with the proposed models. ImageNet-100 and external-domain evaluation are optional extensions rather than mandatory prerequisites.
5.4 Model Selection
The lightweight model will be selected from compact architectures such as MobileNetV3 or a small ResNet variant. The specialist model will use a larger architecture such as ResNet-50, provided the available hardware supports the intended experiments.
For the initial CIFAR-10 experiments, both architectures will be adapted appropriately for small images. The implementation will document changes to the first convolutional layer, image preprocessing, and classifier head.
The models will be evaluated in at least two settings:
- Independent models: Each model is trained separately.
- Matched training conditions: Training data, augmentation, and evaluation protocols are controlled as far as possible.
A specialist model will not automatically be assumed to be more reliable. Its actual accuracy, calibration, and cost will be measured.
5.5 Uncertainty Estimation
Three uncertainty estimators will be considered:
5.5.1 Maximum-Probability Confidence
Given predicted probabilities \(p_k(x)\), the maximum-probability confidence is
A corresponding uncertainty score is
This is a simple baseline. It does not directly measure all forms of uncertainty.
5.5.2 Predictive Entropy
Predictive entropy is defined as
Higher entropy indicates that probability mass is distributed more evenly among classes.
For comparisons across different class counts, normalized entropy may be used:
5.5.3 Evidential Uncertainty
In an evidential model, the network produces evidence \(e_k(x) \geq 0\) for each class [3]. The evidence is converted into Dirichlet parameters:
The total evidence parameter is
The expected class probability is
A simple evidential uncertainty score is
This score is bounded between zero and one for positive Dirichlet parameters satisfying \(\alpha_k \geq 1\). Larger values correspond to lower total evidence under this parameterization.
This quantity is not a universal measure of distribution shift or predictive error. Its interpretation depends on model training and assumptions. The study will test whether it is useful for routing rather than assuming it is inherently superior.
5.6 Adaptive Routing Policy
Let \(u(x)\) be the selected uncertainty score, \(C_L\) the lightweight model cost, and \(C_H\) the incremental cost of invoking the specialist model.
The initial routing rule is
where \(r(x) = 0\) means accepting the lightweight prediction and \(r(x) = 1\) means invoking the specialist model. The threshold \(\tau\) will be selected on validation data.
A more general policy will incorporate an estimated benefit of escalation:
where \(\widehat{\Delta R}(x)\) is the estimated reduction in prediction risk from using the specialist model, and \(\lambda\) controls the trade-off between risk and computation.
The latter policy will only be implemented if a reliable validation procedure can estimate the benefit without using test labels during deployment.
5.7 Mathematical Optimization Objective
Let \(f_r(x)\) denote the final prediction produced by the routing policy. The research will study a constrained objective:
subject to
and, where statistically supportable,
Here:
- \(\theta\) denotes trainable model parameters.
- \(\tau\) denotes the routing threshold.
- \(\ell\) denotes a classification loss.
- \(C(x)\) denotes the computational cost for an input.
- \(B\) denotes the average computational budget.
- \(R(f_r)\) denotes the system's prediction risk.
- \(R_{\max}\) denotes the maximum acceptable risk.
The true test distribution is not available during model development. Consequently, validation data will be used to choose operating points, and the resulting policies will be evaluated on separate test conditions.
The risk constraint will be treated as an empirical target with confidence intervals, not as a formal guarantee unless additional assumptions and a suitable statistical procedure justify such a guarantee.
5.8 Training Objective
For the initial implementation, the lightweight model and specialist model will be trained using cross-entropy loss:
If an evidential model is used, an appropriate evidential training objective will be implemented and compared against the cross-entropy baseline. The study will document the chosen objective, regularization coefficient, optimizer, learning-rate schedule, and stopping criterion.
The routing policy will initially be optimized through validation-based threshold selection. A differentiable routing policy is a possible extension but is not required for the main research question.
5.9 Evaluation Metrics
| Metric | Definition or Purpose | Desired Interpretation |
|---|---|---|
| Top-1 accuracy | Fraction of correctly classified examples | Higher is better |
| Negative log-likelihood (NLL) | Average negative log probability assigned to the true class | Lower is better |
| Expected calibration error (ECE) | Difference between confidence and empirical accuracy across bins | Lower is better, subject to binning limitations |
| Error-detection AUROC | Ability of uncertainty to rank incorrect predictions above correct predictions | Higher is better |
| Corruption error | Classification error under defined corruptions | Lower is better |
| Average FLOPs | Estimated computational operations per input | Lower is generally better |
| Median and 95th-percentile latency | Observed inference time under a fixed environment | Lower is generally better |
| Specialist escalation rate | Fraction of inputs sent to the specialist model | Lower is cheaper, but not necessarily more reliable |
| Risk–coverage curve | Error rate among predictions accepted at different coverage levels | Better reliability at comparable coverage |
ECE will be reported with the number of bins and binning strategy. Because calibration metrics can conceal important differences, they will be accompanied by reliability diagrams and negative log-likelihood.
FLOPs will not be treated as interchangeable with latency. Actual runtime depends on hardware, memory movement, batching, model implementation, and execution overhead.
Mathematical Notation
| Symbol | Meaning | Domain |
|---|---|---|
| \(x\) | Input image | \(\mathcal{X}\) |
| \(y\) | Ground-truth class | \(\{1, \ldots, K\}\) |
| \(K\) | Number of classes | Positive integer |
| \(p_k(x)\) | Predicted probability for class \(k\) | \([0, 1]\) |
| \(e_k(x)\) | Evidential output for class \(k\) | \([0, \infty)\) |
| \(\alpha_k(x)\) | Dirichlet concentration parameter | \([1, \infty)\) |
| \(S(x)\) | Total evidence parameter | \([K, \infty)\) |
| \(u(x)\) | Uncertainty score | Estimator-dependent |
| \(\tau\) | Routing threshold | Validation-selected |
| \(r(x)\) | Routing decision | \(\{0, 1\}\) |
| \(C_L\) | Cost of lightweight inference | Nonnegative |
| \(C_H\) | Incremental specialist inference cost | Nonnegative |
| \(B\) | Average cost budget | Nonnegative |
| \(R\) | Prediction risk | \([0, 1]\) for zero-one loss |
| \(\theta\) | Model parameters | Parameter space |
| \(N\) | Number of evaluated examples | Positive integer |
6.1 Computational Cost
For a two-stage system, an approximate per-input cost is
The expected computational cost is
This approximation assumes that the specialist model's cost is incremental and excludes shared preprocessing. Actual measurements will separately account for preprocessing and routing overhead.
6.2 Classification Risk
Under zero-one loss,
The empirical estimate over \(N\) test examples is
This estimate describes performance on the evaluated sample. It does not establish the true risk under every possible deployment distribution.
Experimental Design
7.1 Baseline Methods
The proposed framework will be compared against the following methods:
- 1Lightweight-only: Always use the compact model.
- 2Specialist-only: Always use the higher-capacity model.
- 3Confidence-based routing: Escalate based on maximum predicted probability.
- 4Entropy-based routing: Escalate based on predictive entropy.
- 5Evidential routing: Escalate based on evidential uncertainty.
- 6Oracle routing (analysis only): Use ground-truth information to select the better model for each input. This is an unattainable reference and will not be presented as a deployable baseline.
All practical routing methods will be evaluated using validation-selected thresholds and comparable computational accounting.
7.2 Controlled Experiments
The experimental plan includes:
- Experiment A — Clean test performance: Measure classification accuracy, calibration, and cost on the original test distribution.
- Experiment B — Corruption robustness: Evaluate noise, blur, contrast, weather, and other supported corruption types across defined severity levels.
- Experiment C — Uncertainty quality: Test whether uncertainty scores distinguish incorrect predictions from correct predictions.
- Experiment D — Budget-constrained routing: Compare accuracy and risk at several average computational budgets.
- Experiment E — Ablation study: Remove or replace individual components to estimate their contribution.
- Experiment F — Reproducibility: Repeat training with multiple random seeds and report variability.
7.3 Ablation Table Template
| Configuration | Evidential Score | Specialist Escalation | Cost Constraint | Status |
|---|---|---|---|---|
| A | No | No | No | Planned |
| B | No | Yes | No | Planned |
| C | Entropy | Yes | Yes | Planned |
| D | Evidential | Yes | No | Planned |
| E | Evidential | Yes | Yes | Planned |
| F | Evidential + alternative calibration | Yes | Yes | Optional |
7.4 Statistical Analysis
For each main configuration, experiments will use multiple random seeds where feasible. The report will include means and standard deviations or confidence intervals.
Paired comparisons will use identical test examples and matched experimental settings. The statistical method will be selected according to the metric and sampling structure.
For classification accuracy, bootstrap confidence intervals or appropriate paired tests may be used. Multiple comparisons will be interpreted cautiously, and effect sizes will accompany significance tests where appropriate.
Illustrative Results and Visualization Specifications
Important: This section demonstrates how a completed proposal or research webpage might present results. Every numerical value in the tables and plots below is fictional and illustrative. No experiments have been reported as performed. These values must be replaced with actual measurements before the document is used as a scientific report.
8.1 Illustrative Accuracy Comparison
Table 2: Hypothetical classification accuracy under three evaluation conditions.
| Method | Clean Accuracy (%) | Corrupted Accuracy (%) | Severe-Shift Accuracy (%) |
|---|---|---|---|
| Lightweight-only | 84.0 | 64.0 | 48.0 |
| Specialist-only | 90.0 | 74.0 | 61.0 |
| Confidence routing | 87.0 | 69.0 | 55.0 |
| Entropy routing | 87.5 | 70.0 | 56.0 |
| Evidential routing | 88.0 | 72.0 | 58.0 |
Note: Hypothetical values only. They are not empirical findings, published benchmarks, or expected guarantees.
The example illustrates a comparison in which routing methods occupy different points on the accuracy–cost trade-off. A real study may produce different rankings, and the evidential method may not outperform the alternatives.
8.2 Figure 2 — Proposed Accuracy–Cost Curve
The following specification describes the main performance figure to generate from actual experiment logs:
- Horizontal axis: Average inference cost, normalized to the cost of the specialist-only baseline.
- Vertical axis: Top-1 classification accuracy.
- Series: Lightweight-only, specialist-only, confidence routing, entropy routing, and evidential routing.
- Conditions: Separate curves for clean and shifted test distributions.
- Error bars: Variation across seeds or bootstrap intervals, as appropriate.
The primary question is whether the proposed method reaches comparable accuracy at lower average cost, or higher accuracy under the same cost budget.
8.3 Figure 3 — Reliability Diagram
A reliability diagram will group predictions into confidence bins. For each bin, the average predicted confidence will be compared with observed accuracy:
- The diagonal reference line represents ideal calibration.
- Deviations from this line indicate calibration error.
- The figure will include separate curves for clean and shifted test data.
- The experiment will not infer reliability under arbitrary deployment conditions from a single diagram.
8.4 Figure 4 — Uncertainty-Based Error Detection
An error-detection curve will evaluate whether the uncertainty score ranks incorrect predictions above correct predictions:
- AUROC will summarize discrimination performance.
- Risk–coverage curves will show the error rate when increasingly uncertain predictions are rejected or escalated.
- These figures will help distinguish uncertainty estimation quality from the final performance of the routing policy.
8.5 Interpretation Protocol
Results will be interpreted using the following rules:
- 1A higher accuracy value alone does not establish a better method if computational cost increases substantially.
- 2A lower ECE alone does not establish robustness to distribution shift.
- 3A lower escalation rate is not beneficial if the system becomes substantially less reliable.
- 4A routing method that performs well on one corruption type may fail on another.
- 5An apparent improvement will be reported with uncertainty estimates and implementation details.
Expected Contributions
The project aims to deliver the following outputs:
- 9.1 Methodological Contribution: A clearly specified uncertainty-guided routing framework for allocating computation between a lightweight classifier and a specialist classifier.
- 9.2 Empirical Contribution: A controlled comparison of evidential, entropy-based, and confidence-based routing under clean and distribution-shifted evaluation conditions.
- 9.3 Practical Contribution: A reproducible implementation and evaluation protocol that reports both predictive performance and computational cost.
- 9.4 Scientific Contribution: An empirical analysis of when uncertainty-guided routing succeeds or fails, including cases in which uncertainty estimates do not reliably identify incorrect predictions.
These are intended contributions. Their novelty and significance will be determined by the completed literature review and experimental findings.
Research Significance
10.1 Academic Significance
The research connects uncertainty estimation, robust machine learning, and adaptive computation. It may help clarify the conditions under which uncertainty estimates are useful for inference-time resource allocation.
10.2 Industrial Significance
The proposed approach could be relevant to automated visual inspection, where image quality, defect complexity, and hardware constraints vary. A lightweight-first system may reduce average computation if escalation is selective and reliable.
10.3 Environmental and Computational Significance
Reducing unnecessary computation may lower energy consumption in some deployment settings. However, energy savings will not be claimed unless measured or estimated using a documented methodology.
10.4 Future Research Directions
Possible extensions include:
- Open-set recognition and unknown-class detection.
- Online monitoring of changing deployment distributions.
- Multi-expert routing under heterogeneous hardware budgets.
- Edge–cloud collaborative inference.
- Selective prediction with explicit abstention.
- Risk-aware routing for industrial applications.
Scope, Assumptions, and Limitations
11.1 Scope
The core study will focus on image classification using two model pathways and a limited number of uncertainty estimators. Experiments will use public datasets and controlled evaluation conditions.
11.2 Assumptions
- The study assumes that the model can estimate an uncertainty score at inference time and that a specialist model is available when escalation is required.
- The routing policy will not have access to ground-truth labels at deployment time.
11.3 Limitations
- Uncertainty limitations: Evidential uncertainty may not detect every form of distribution shift and can itself be miscalibrated.
- Dataset limitations: Synthetic corruptions do not fully represent real-world changes in sensors, environments, or data collection procedures.
- Computational limitations: Small-scale experiments may not predict latency or energy consumption on all deployment hardware.
- Routing limitations: The specialist model may make the same mistakes as the lightweight model, so escalation is not guaranteed to improve a prediction.
- Generalization limitations: A policy selected using one validation distribution may not remain optimal on unseen deployment conditions.
- Novelty limitations: Related uncertainty-aware and adaptive inference methods already exist. A thorough comparison with recent literature is necessary before claiming a novel algorithmic contribution.
Ethical Considerations and Reproducibility
The project will primarily use public, non-personal image datasets. Dataset licenses, usage restrictions, and attribution requirements will be reviewed before use.
The study will avoid claims of clinical, safety-critical, or industrial readiness without appropriate validation. Model limitations and failure cases will be reported alongside successful results.
Reproducibility procedures will include:
- Recording dataset versions and preprocessing steps.
- Documenting model architectures and training configurations.
- Setting and reporting random seeds.
- Separating training, validation, and test data.
- Preserving experiment logs and model checkpoints.
- Reporting all relevant baselines and ablation studies.
- Clearly distinguishing measured results from illustrative examples.
- Publishing code and configuration files where licensing permits.
No human-participant study is planned for the core project. If future work introduces personal or sensitive data, the necessary institutional ethics review and data-protection procedures will be followed.
Research Timeline
Table 3: Proposed 24-month schedule.
| Phase | Activities | Duration |
|---|---|---|
| 1 | Literature review and research refinement | Months 1–3 |
| 2 | Dataset preparation and baseline implementation | Months 4–6 |
| 3 | Uncertainty estimation and calibration experiments | Months 7–9 |
| 4 | Adaptive routing policy development | Months 10–12 |
| 5 | Shifted-data experiments and ablation studies | Months 13–15 |
| 6 | Statistical analysis and robustness evaluation | Months 16–18 |
| 7 | Thesis and manuscript preparation | Months 19–21 |
| 8 | Revision, final submission, and defence preparation | Months 22–24 |
gantt
    title Proposed 24-Month Research Plan
    dateFormat YYYY-MM
    axisFormat %b %Y
    section Foundations
    Literature review       :a1, 2027-02, 3M
    Dataset and baselines   :a2, after a1, 3M
    section Development
    Uncertainty estimation  :b1, after a2, 3M
    Routing policy          :b2, after b1, 3M
    section Evaluation
    Shift and ablation tests:c1, after b2, 3M
    Statistical analysis    :c2, after c1, 3M
    section Reporting
    Thesis and manuscript   :d1, after c2, 3M
    Revision and defence    :d2, after d1, 3M
Figure 5: Timeline overview. The timeline assumes a February 2027 start. The actual schedule should be adjusted to the admission date, supervisor guidance, and programme requirements.
Resources and Feasibility
14.1 Software
The proposed implementation will use:
- Python for experimental scripts and data processing.
- PyTorch for model training and inference.
- NumPy and pandas for data handling.
- scikit-learn for evaluation utilities.
- Matplotlib for plots and figures.
- Git for version control.
- A configuration system for recording hyperparameters and experiment settings.
14.2 Hardware
The initial experiments will target a single consumer GPU or equivalent cloud GPU access. Smaller models and CIFAR-10 experiments will be prioritized if computing resources are limited.
Large-scale datasets and expensive ensemble configurations will be optional extensions. The research question can be studied meaningfully without requiring a large multi-GPU cluster.
14.3 Feasibility Assessment
The project is feasible as a master's research project if its scope remains focused on two models, a limited set of uncertainty estimators, and carefully controlled distribution shifts.
The main risks are the computational cost of repeated experiments, the difficulty of estimating uncertainty reliably, and the possibility that the proposed method does not outperform simpler baselines. These risks will be addressed through staged experiments, compute-aware model selection, and explicit reporting of negative results.
Conclusion
This proposal presents a research plan for uncertainty-guided adaptive inference under distribution shift. The proposed system uses a lightweight model for initial predictions and selectively invokes a specialist model when additional computation may improve reliability.
The study combines mathematical uncertainty estimation, adaptive decision-making, and controlled deep learning experiments. Its primary objective is to establish whether evidential uncertainty provides practical value beyond simpler confidence-based and entropy-based routing policies.
The research will evaluate accuracy, calibration, robustness, computational cost, and constraint satisfaction. Its scientific value will depend on rigorous comparisons, transparent reporting, and reproducible experiments rather than on the assumption that the proposed method must succeed.
The expected final output is a master's thesis supported by a reproducible experimental implementation and, if the findings justify it, a research manuscript suitable for submission to an appropriate peer-reviewed venue.
References
- [1]C. Guo, G. Pleiss, Y. Sun, and K. Q. Weinberger, “On Calibration of Modern Neural Networks,” in Proceedings of the 34th International Conference on Machine Learning (ICML), PMLR, vol. 70, pp. 1321–1330, 2017. [Online]. Available: https://proceedings.mlr.press/v70/guo17a.html
- [2]B. Lakshminarayanan, A. Pritzel, and C. Blundell, “Simple and Scalable Predictive Uncertainty Estimation using Deep Ensembles,” in Advances in Neural Information Processing Systems, vol. 30, 2017. [Online]. Available: https://arxiv.org/abs/1612.01474
- [3]M. Sensoy, L. Kaplan, and M. Kandemir, “Evidential Deep Learning to Quantify Classification Uncertainty,” in Advances in Neural Information Processing Systems, vol. 31, 2018. [Online]. Available: https://arxiv.org/abs/1806.01768
- [4]S. Teerapittayanon, B. McDanel, and H. T. Kung, “BranchyNet: Fast Inference via Early Exiting from Deep Neural Networks,” in 2016 23rd International Conference on Pattern Recognition (ICPR), pp. 2464–2469, 2016. DOI: 10.1109/ICPR.2016.7900006
- [5]D. Hendrycks and T. Dietterich, “Benchmarking Neural Network Robustness to Common Corruptions and Perturbations,” in International Conference on Learning Representations (ICLR), 2019. [Online]. Available: https://arxiv.org/abs/1903.12261
- [6]A. Krizhevsky, “Learning Multiple Layers of Features from Tiny Images,” University of Toronto, Technical Report, 2009. [Online]. Available: https://www.cs.toronto.edu/~kriz/learning-features-2009-TR.pdf
- [7]N. Shazeer et al., “Outrageously Large Neural Networks: The Sparsely-Gated Mixture-of-Experts Layer,” in International Conference on Learning Representations (ICLR), 2017. [Online]. Available: https://arxiv.org/abs/1701.06538
- [8]Y. Gal and Z. Ghahramani, “Dropout as a Bayesian Approximation: Representing Model Uncertainty in Deep Learning,” in Proceedings of the 33rd International Conference on Machine Learning (ICML), PMLR, vol. 48, pp. 1050–1059, 2016. [Online]. Available: https://proceedings.mlr.press/v48/gal16.html
- [9]T. Chen et al., “Big Self-Supervised Models are Strong Semi-Supervised Learners,” in Advances in Neural Information Processing Systems, vol. 33, 2020. [Online]. Available: https://arxiv.org/abs/2006.10029
- [10]D. Wang et al., “Tent: Fully Test-Time Adaptation by Entropy Minimization,” in International Conference on Learning Representations (ICLR), 2021. [Online]. Available: https://arxiv.org/abs/2006.10029
- [11]J. Deng et al., “ImageNet: A Large-Scale Hierarchical Image Database,” in 2009 IEEE Conference on Computer Vision and Pattern Recognition, pp. 248–255, 2009. DOI: 10.1109/CVPR.2009.5206848
Appendices
Appendix A. Illustrative Routing Algorithm
Algorithm 1: Uncertainty-Guided Adaptive Inference
------------------------------------------------------------------------------------------------
Input  : Image x, lightweight model f_L, specialist model f_H, uncertainty estimator U, threshold tau.
Output : Final prediction y_hat, measured computational cost C.

1. Compute the lightweight model output:
       p_L = f_L(x)
2. Estimate uncertainty:
       u = U(p_L, x)
3. If u <= tau:
       Accept the lightweight prediction:
       y_hat = argmax p_L
       C = C_L
4. Else (u > tau):
       Compute the specialist model output:
       p_H = f_H(x)
       Determine final prediction according to predefined policy:
       y_hat = argmax p_H
       C = C_L + C_H
5. Record prediction, uncertainty, route, latency, and computational cost.
------------------------------------------------------------------------------------------------
Note: The implementation will also record cases where specialist escalation fails to correct an incorrect lightweight prediction.
Appendix B. Example Experiment Record
| Field | Example Value |
|---|---|
| Experiment ID | DEMO-EXP-001 |
| Dataset | CIFAR-10-C |
| Model Pair | Compact ResNet / ResNet-50 |
| Uncertainty Method | Evidential |
| Random Seed | 42 |
| Corruption | Gaussian noise |
| Severity | 3 |
| Routing Threshold | Selected on validation data |
| Evaluation Status | Planned |
| Result Status | Not measured |
| Code Revision | To be recorded |
| Hardware | To be recorded |
Note: This record illustrates the minimum metadata needed to trace a reported result to a specific experiment.
Appendix C. Document and Publication Metadata
The following metadata are proposed for use by a research document webpage or digital repository.
| Metadata Field | Value |
|---|---|
| Title | Evidential Uncertainty-Guided Adaptive Inference Under Distribution Shift |
| Subtitle | Compute-Aware Routing for Reliable Visual Recognition |
| Author | Alex Morgan (fictional demonstration author) |
| Author Identifier | Not assigned |
| Affiliation | Example Institute of Computing |
| Document Type | Research proposal |
| Academic Discipline | Computer Science |
| Subdisciplines | Artificial Intelligence, Machine Learning, Applied Mathematics |
| Version | 1.0 |
| Date Created | 2026-10-29 |
| Date Modified | 2026-10-29 |
| Publication Date | Not published |
| DOI | Not assigned |
| ISBN | Not applicable |
| Status | Demonstration |
| Language | en |
| License | CC BY 4.0, intended demonstration license |
| Keywords | Adaptive inference; uncertainty; distribution shift; computer vision |
| Abstract | See Section Abstract |
| Citation Style | IEEE |
| References Count | 11 |
| Figures | Conceptual diagrams, planned evaluation plots, and timeline |
| Tables | Research questions, notation, datasets, metrics, experimental plans |
| Supplementary Materials | Algorithm, experiment record, metadata |
| Funding | None declared |
| Conflicts of Interest | None declared for the fictional example |
| Acknowledgements | None |
| Research Data | No experimental data generated for this demonstration |
| Code Repository | Not assigned |
| Peer-Review Status | Not peer reviewed |
Suggested Citation:
Morgan, A. (2026). Evidential Uncertainty-Guided Adaptive Inference Under Distribution Shift: Compute-Aware Routing for Reliable Visual Recognition (Version 1.0). Demonstration research proposal. Example Institute of Computing.
Citation note: The author, institution, and citation are fictional placeholders. This citation is intended only to demonstrate metadata formatting and must not be represented as a real publication.
Appendix D. Suggested Webpage Content Structure
For a research document website, the proposal can be represented as structured content rather than a single long text field.
| Component | Suggested Data Fields |
|---|---|
| Document header | Title, subtitle, author, affiliation, document type, date, version |
| Abstract panel | Abstract, keywords, status |
| Table of contents | Section identifiers, headings, hierarchy |
| Research content | Markdown or structured rich text |
| Mathematical content | LaTeX equations and notation |
| Figures | Image source, caption, figure number, alternative text |
| Tables | Structured headers, rows, captions, footnotes |
| References | Authors, title, venue, year, DOI or URL |
| Results panels | Metrics, experimental condition, provenance, confidence intervals |
| Supplementary material | Files, code links, datasets, appendices |
| Document history | Version, date, change summary |
| Citation tools | BibTeX, RIS, plain-text citation |
| Access information | License, visibility, publication status |
A useful distinction for the website is between proposed methods, planned experiments, and measured results. Each should have an explicit status so that readers cannot mistake illustrative content for completed scientific work.